Back to rankings

louisnw01/lightweight-charts-python

TypeScript

Python framework for TradingView's Lightweight Charts JavaScript library.

plottingpythontradingviewfinancial-charting-librarylive-chartscharting-libraryohlc-chart
Star Growth
Stars
2.1k
Forks
428
Weekly Growth
Issues
106
5001k1.5k2k
May 2023May 2024Jun 2025Jul 2026
Artifactsnpmnpm install lightweight-charts-python
README

lightweight-charts-python

PyPi Release Made with Python License Documentation

cover

lightweight-charts-python aims to provide a simple and pythonic way to access and implement TradingView's Lightweight Charts.

Installation

pip install lightweight-charts

Features

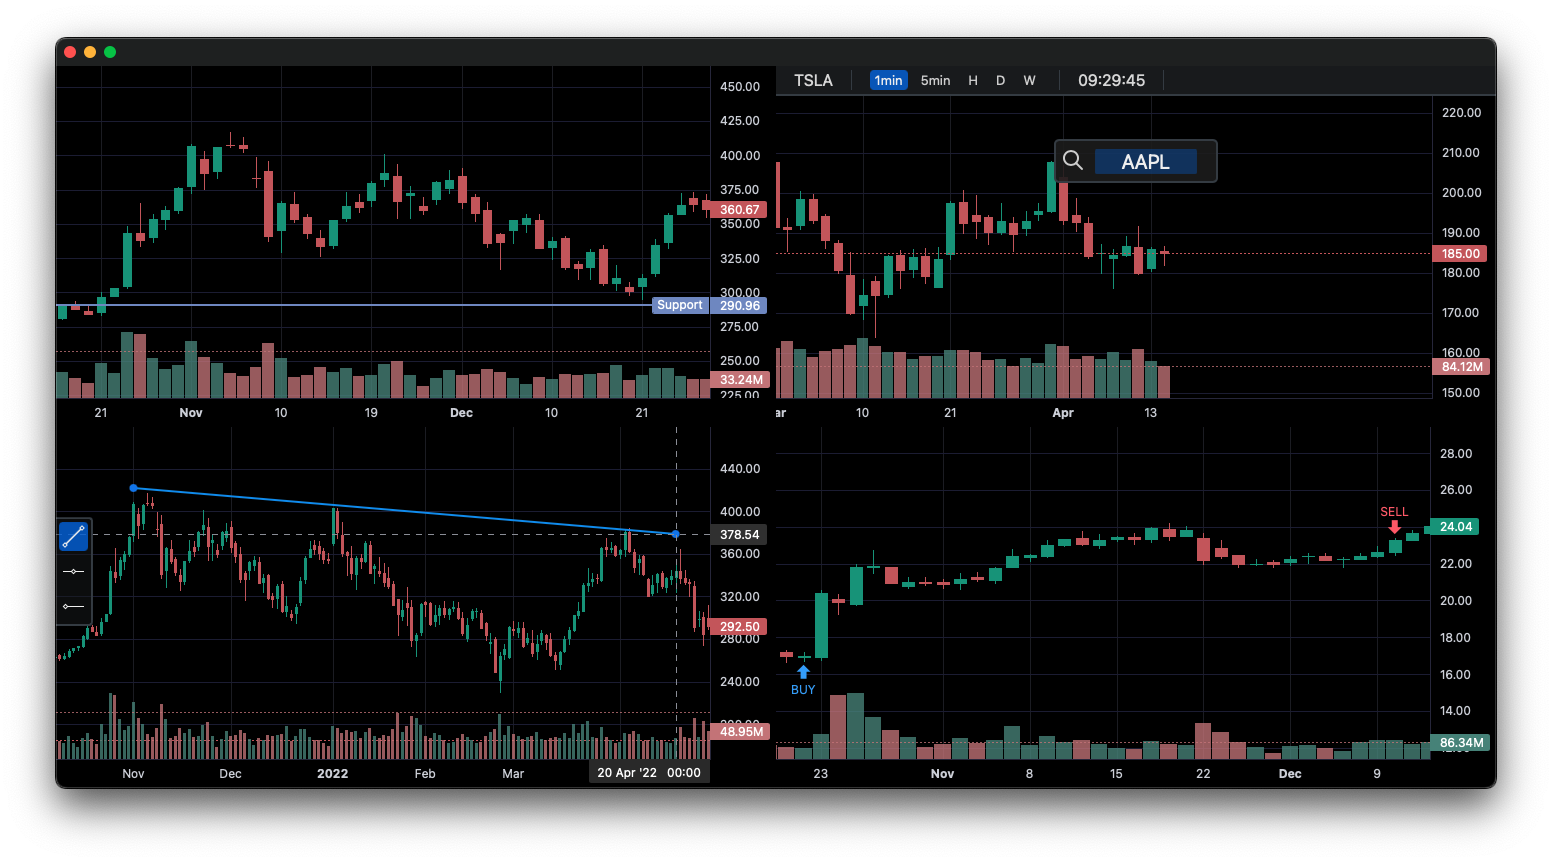
  1. Streamlined for live data, with methods for updating directly from tick data.
  2. Multi-pane charts using Subcharts.
  3. The Toolbox, allowing for trendlines, rectangles, rays and horizontal lines to be drawn directly onto charts.
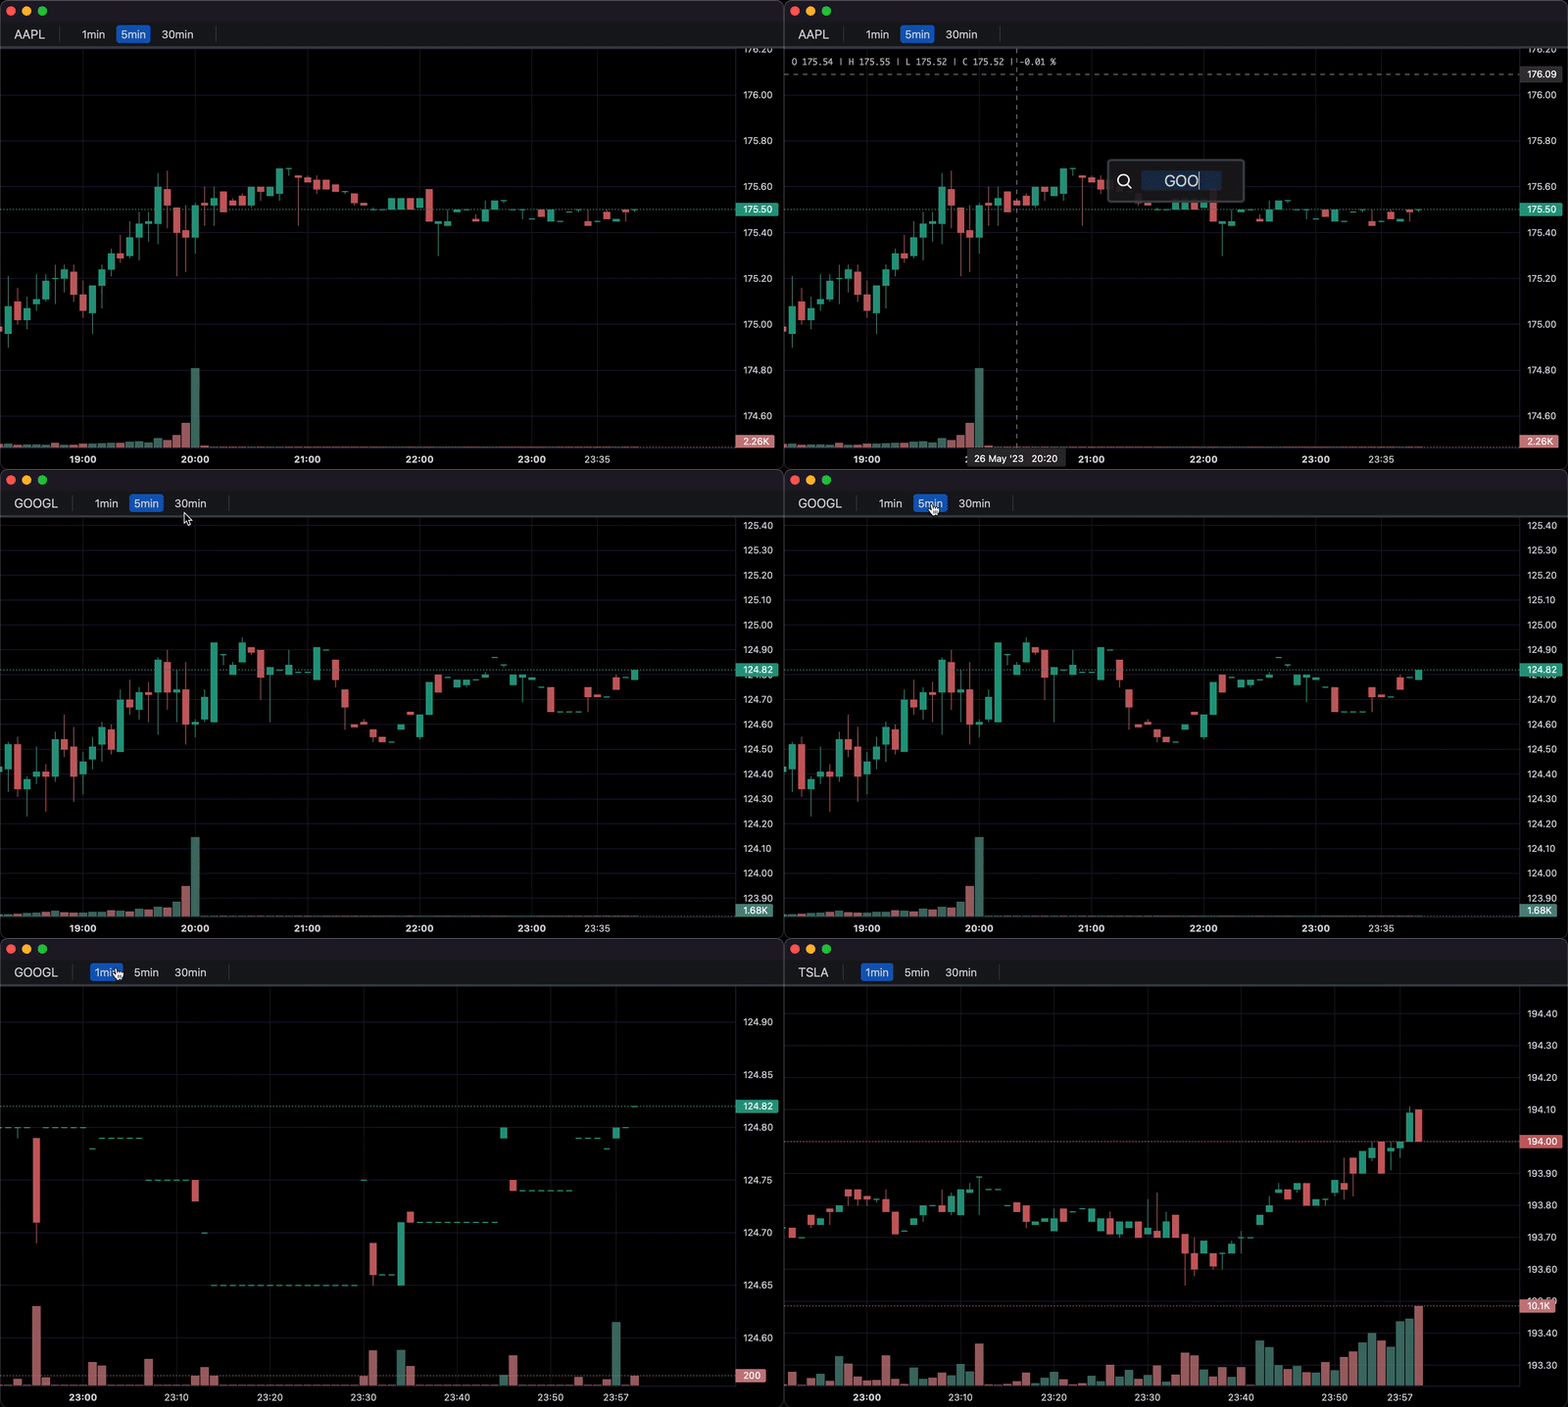
  4. Events allowing for timeframe selectors (1min, 5min, 30min etc.), searching, hotkeys, and more.
  5. Tables for watchlists, order entry, and trade management.
  6. Direct integration of market data through Polygon.io's market data API.

Supports: Jupyter Notebooks, PyQt6, PyQt5, PySide6, wxPython, Streamlit, and asyncio.

PartTimeLarry: Interactive Brokers API and TradingView Charts in Python


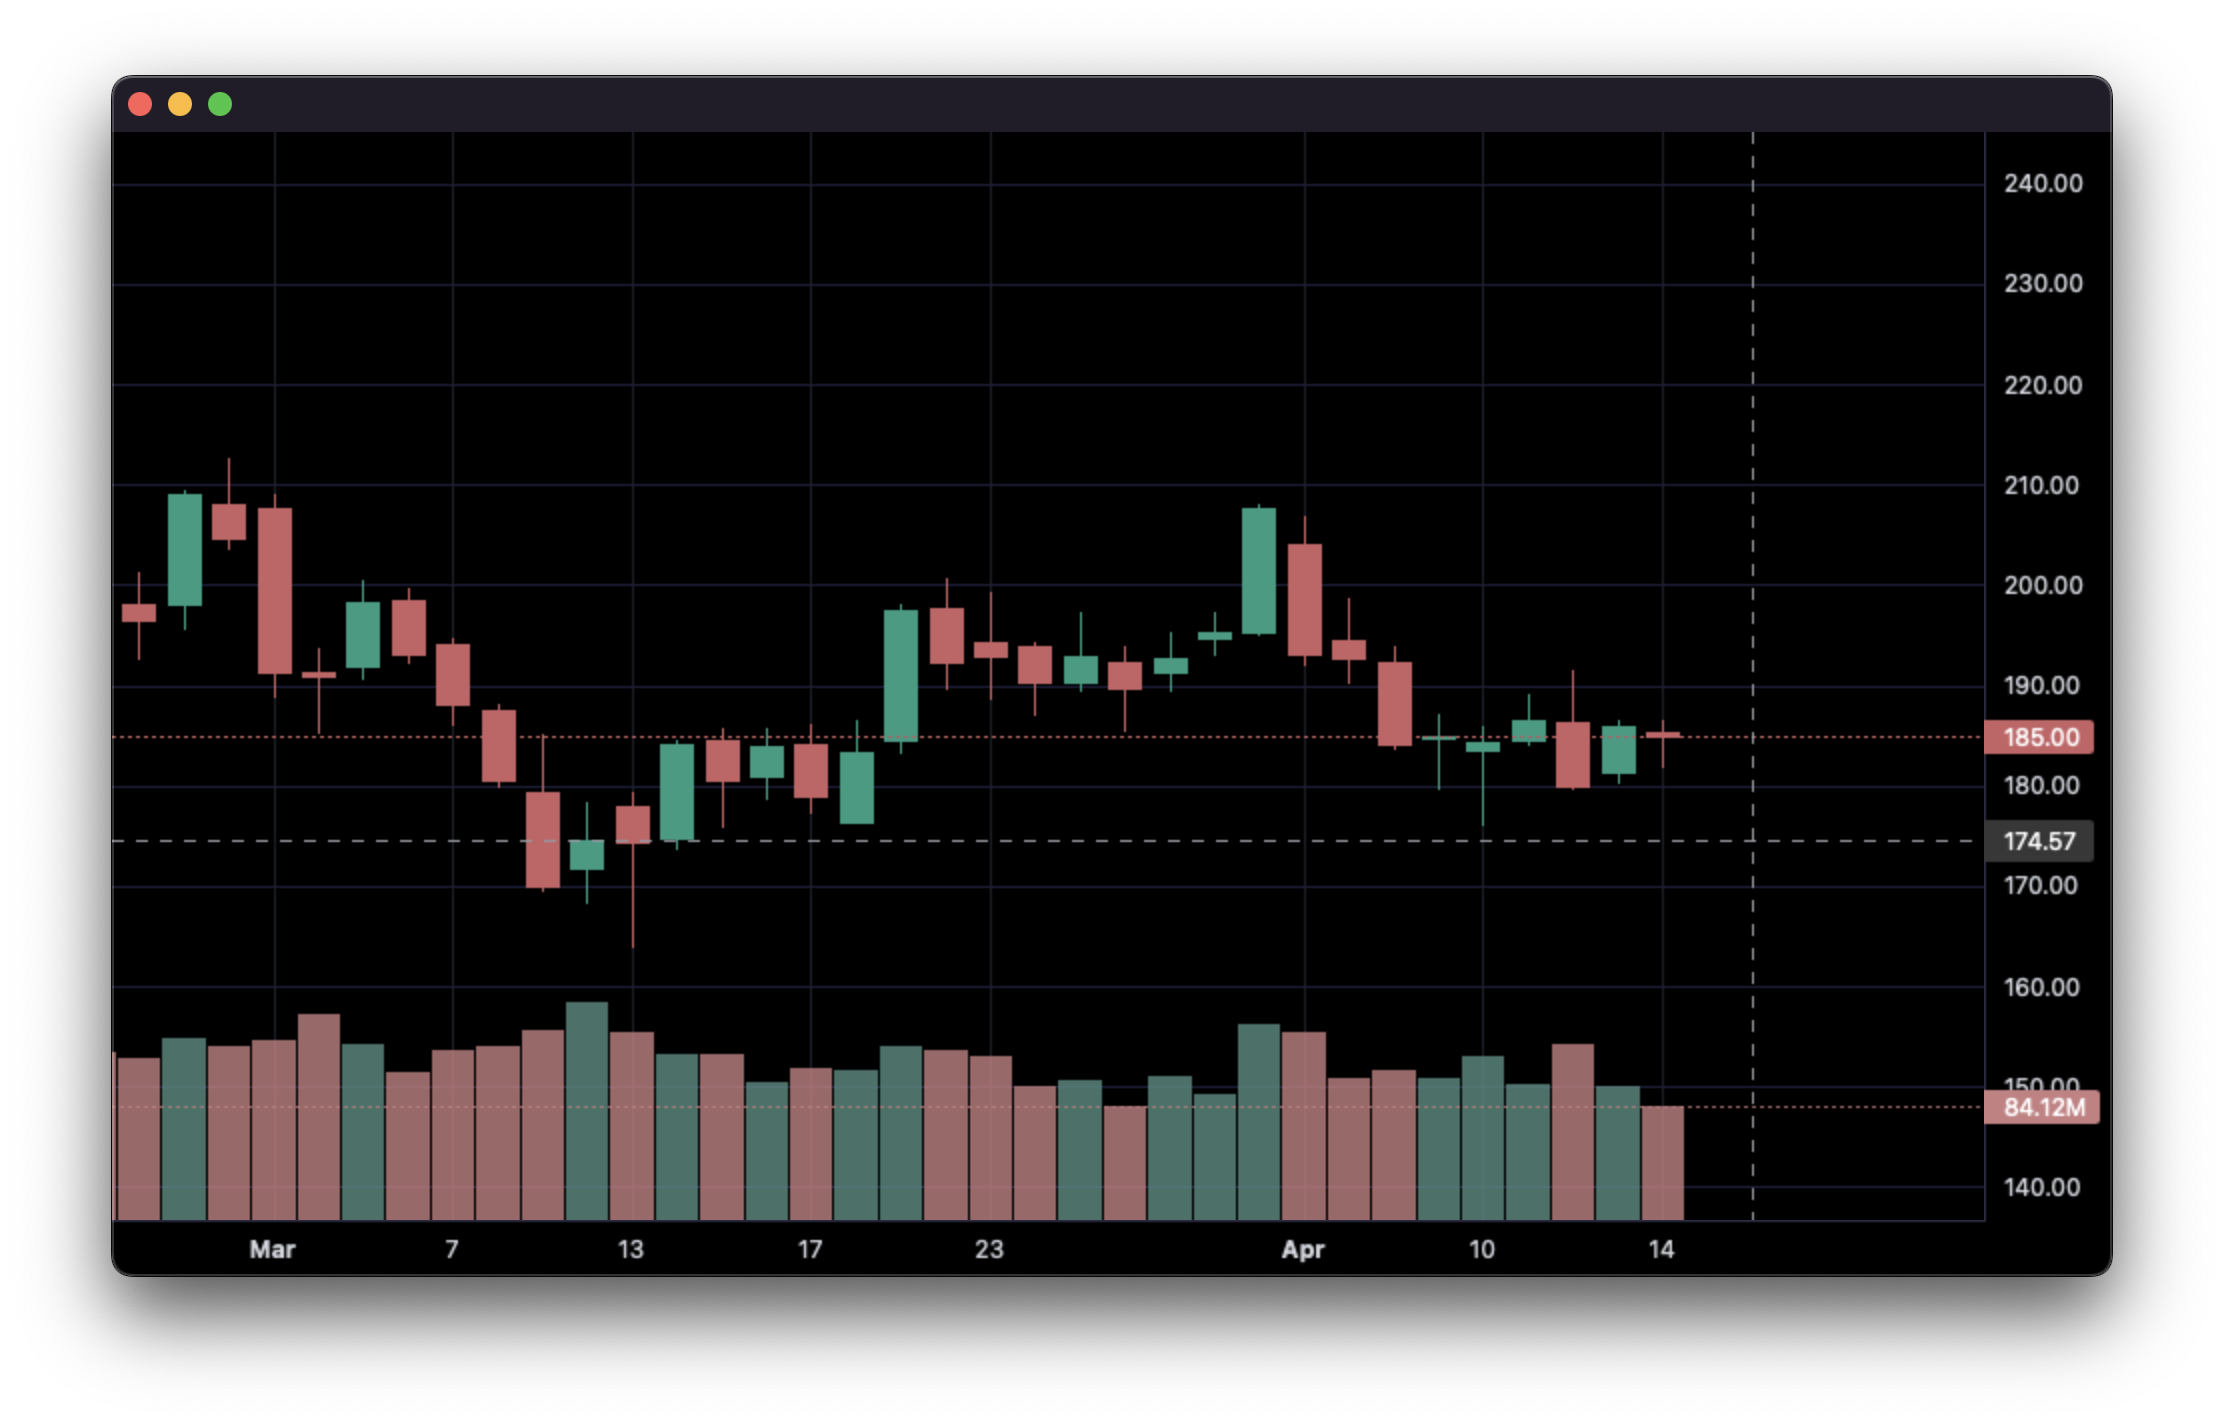
1. Display data from a csv:

import pandas as pd
from lightweight_charts import Chart


if __name__ == '__main__':
    
    chart = Chart()
    
    # Columns: time | open | high | low | close | volume 
    df = pd.read_csv('ohlcv.csv')
    chart.set(df)
    
    chart.show(block=True)

setting_data image


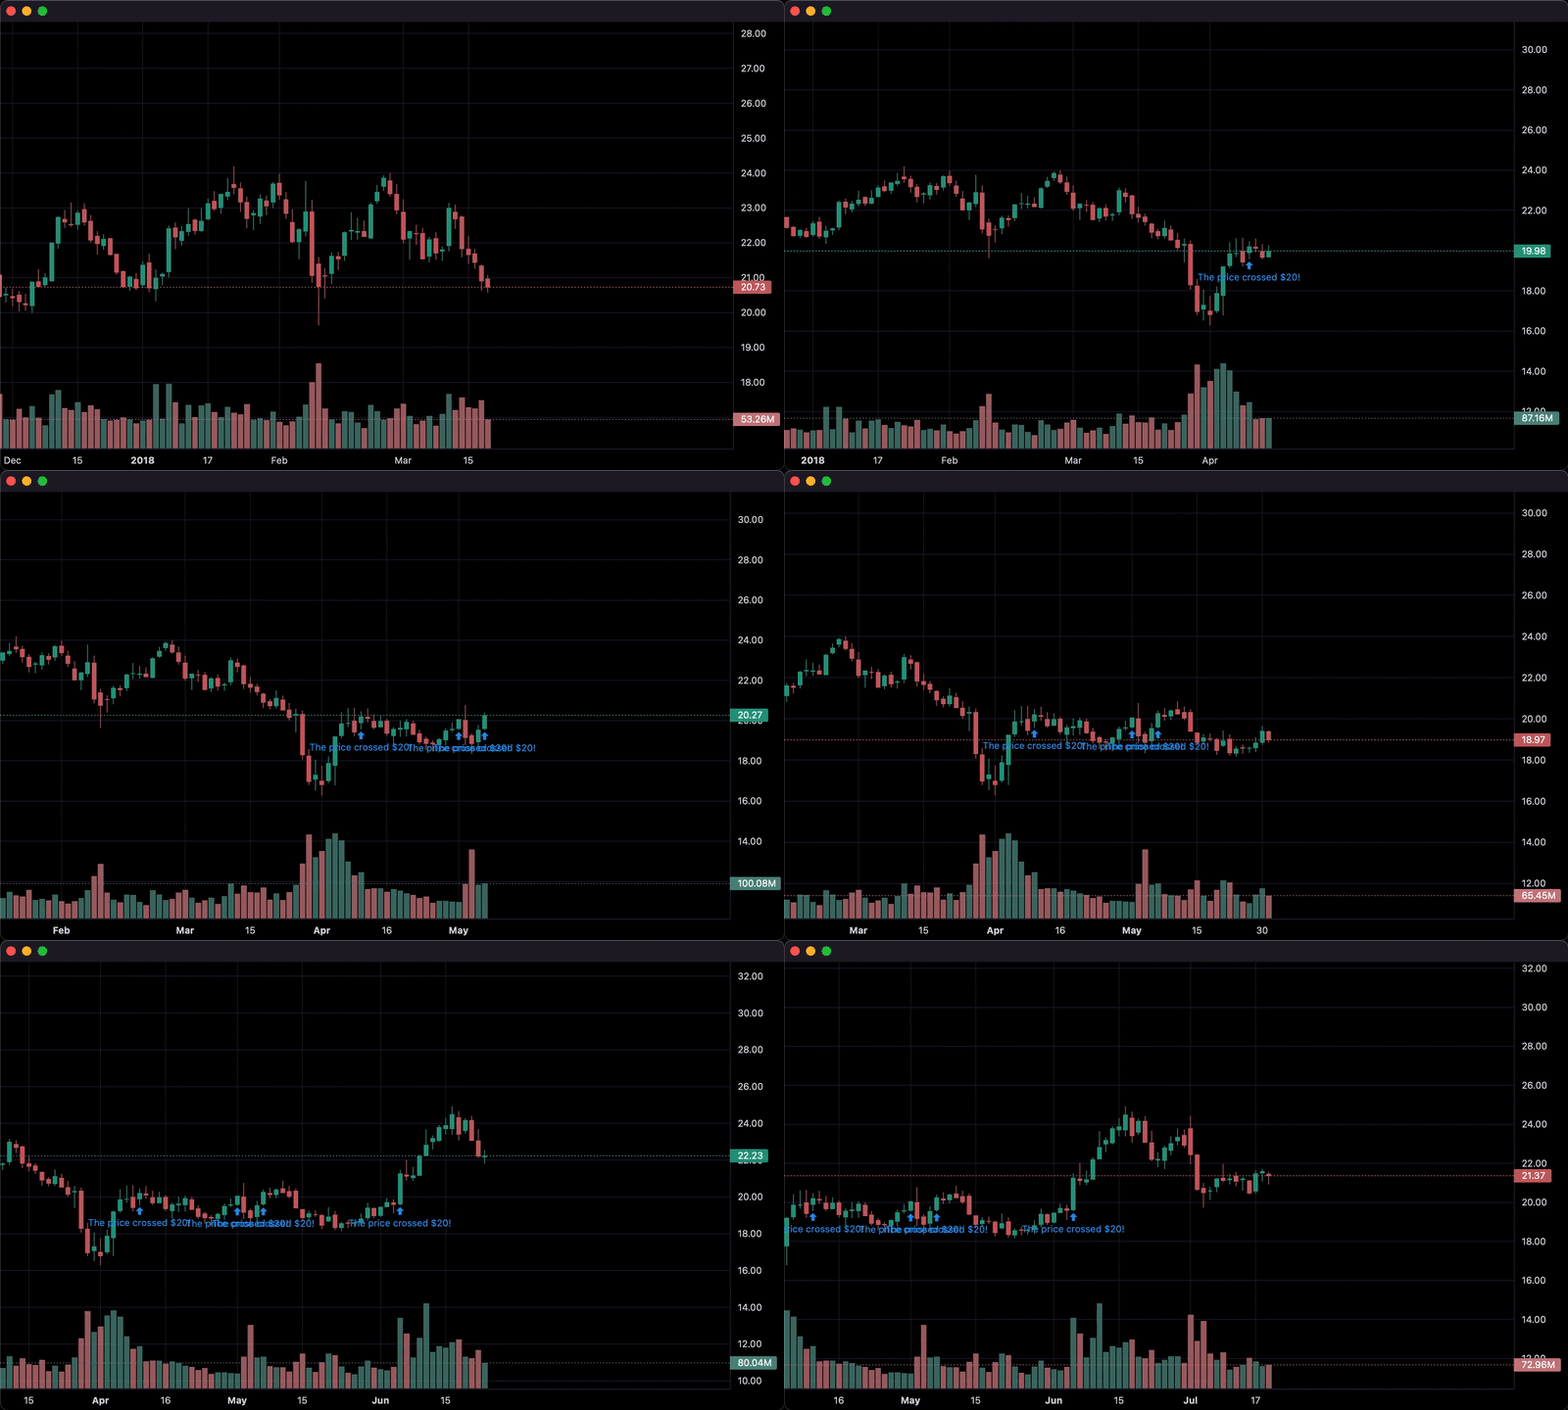
2. Updating bars in real-time:

import pandas as pd
from time import sleep
from lightweight_charts import Chart

if __name__ == '__main__':

    chart = Chart()

    df1 = pd.read_csv('ohlcv.csv')
    df2 = pd.read_csv('next_ohlcv.csv')

    chart.set(df1)

    chart.show()

    last_close = df1.iloc[-1]['close']
    
    for i, series in df2.iterrows():
        chart.update(series)

        if series['close'] > 20 and last_close < 20:
            chart.marker(text='The price crossed $20!')
            
        last_close = series['close']
        sleep(0.1)

live data gif


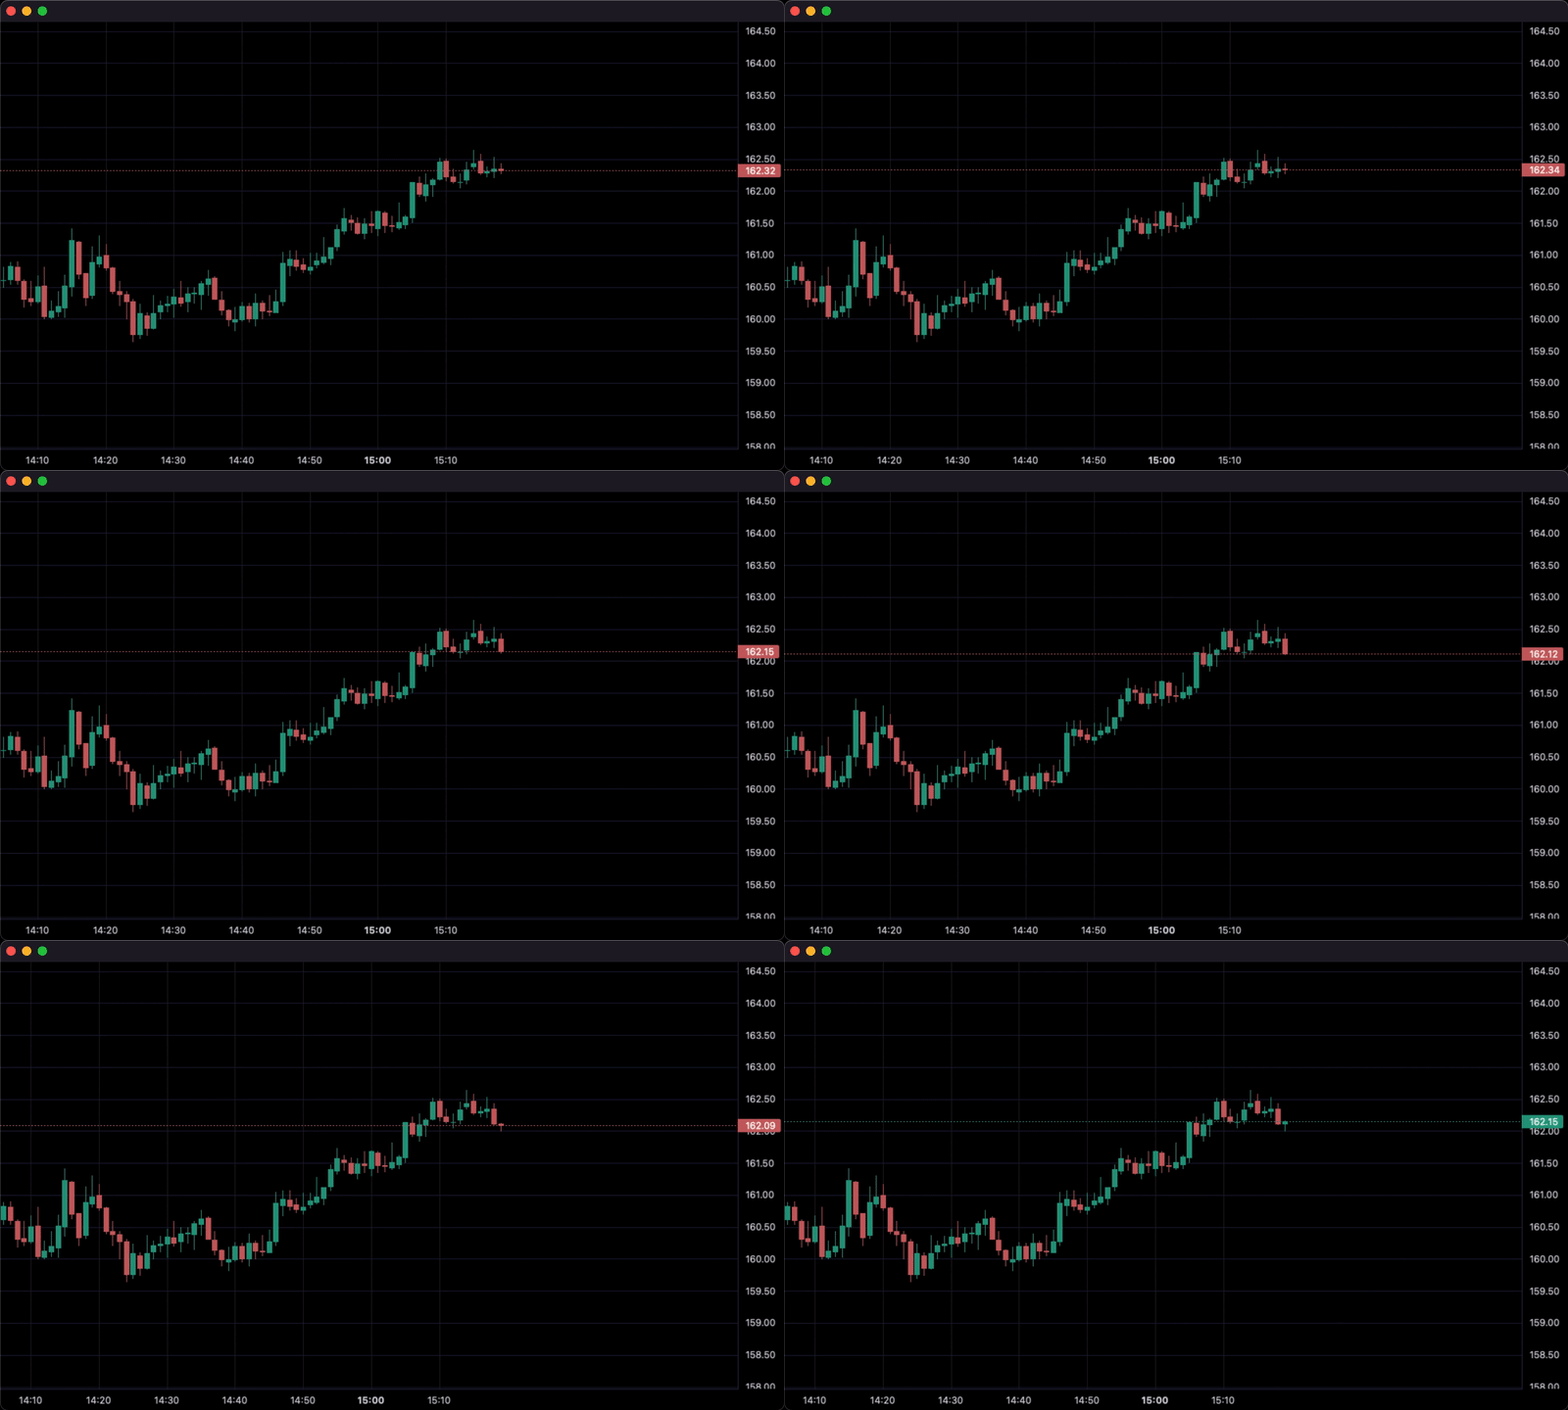
3. Updating bars from tick data in real-time:

import pandas as pd
from time import sleep
from lightweight_charts import Chart


if __name__ == '__main__':
    
    df1 = pd.read_csv('ohlc.csv')
    
    # Columns: time | price 
    df2 = pd.read_csv('ticks.csv')
    
    chart = Chart()
    
    chart.set(df1)
    
    chart.show()
    
    for i, tick in df2.iterrows():
        chart.update_from_tick(tick)
            
        sleep(0.03)

tick data gif


4. Line Indicators:

import pandas as pd
from lightweight_charts import Chart


def calculate_sma(df, period: int = 50):
    return pd.DataFrame({
        'time': df['date'],
        f'SMA {period}': df['close'].rolling(window=period).mean()
    }).dropna()


if __name__ == '__main__':
    chart = Chart()
    chart.legend(visible=True)

    df = pd.read_csv('ohlcv.csv')
    chart.set(df)

    line = chart.create_line('SMA 50')
    sma_data = calculate_sma(df, period=50)
    line.set(sma_data)

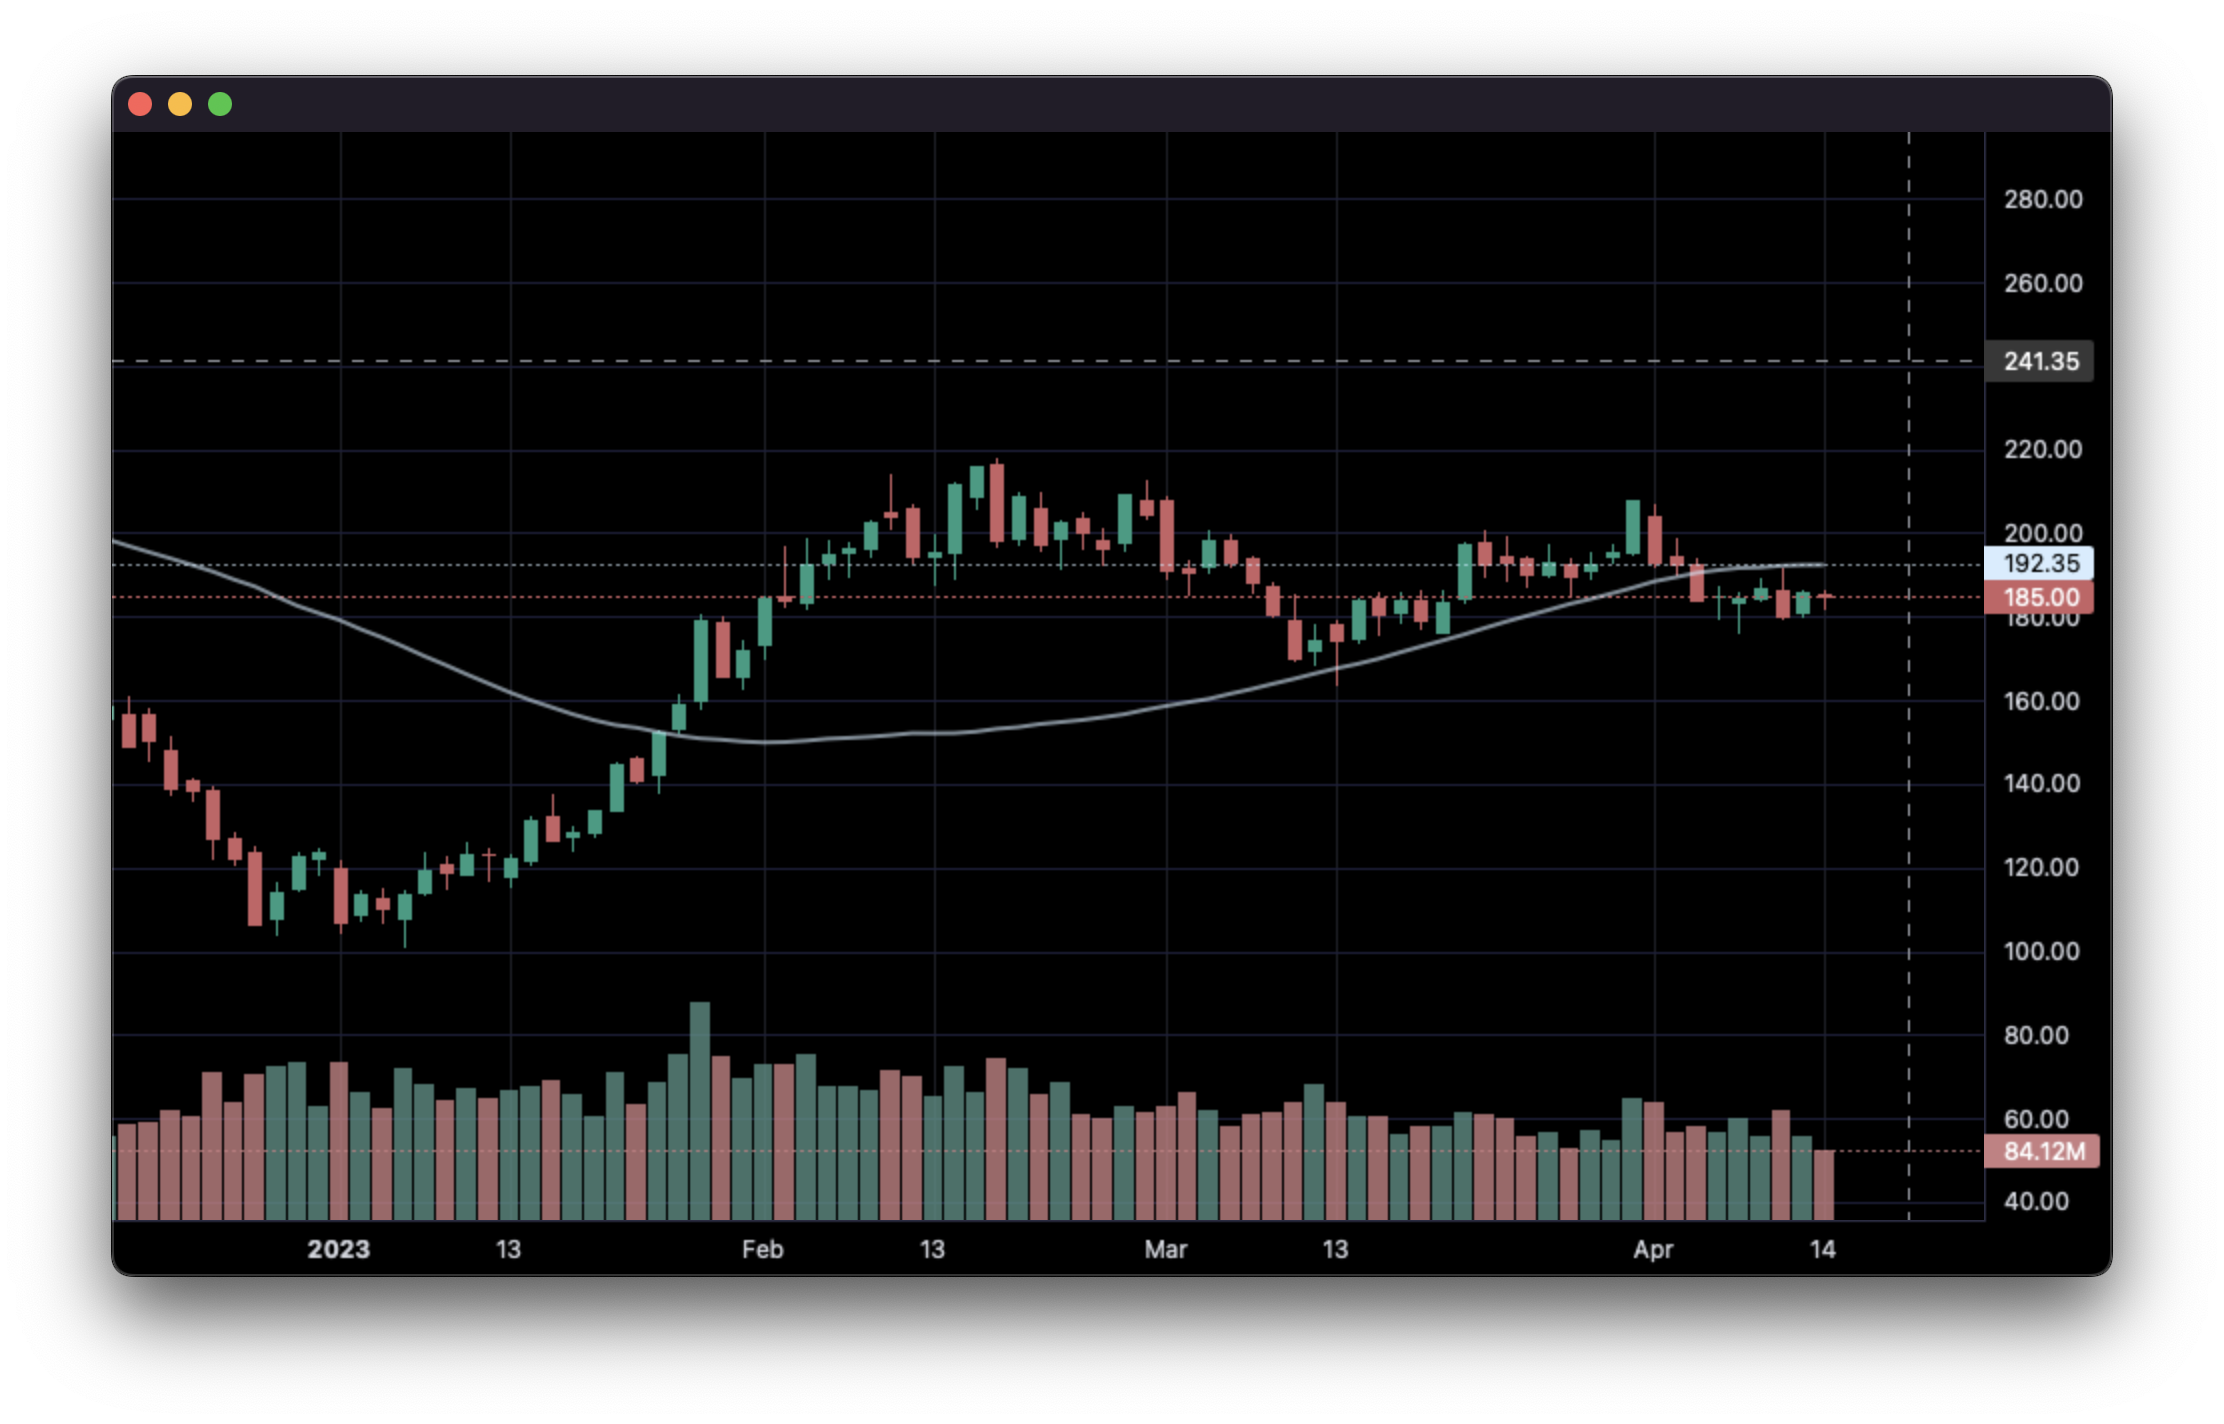
    chart.show(block=True)

line indicators image


5. Styling:

import pandas as pd
from lightweight_charts import Chart


if __name__ == '__main__':
    
    chart = Chart()

    df = pd.read_csv('ohlcv.csv')

    chart.layout(background_color='#090008', text_color='#FFFFFF', font_size=16,
                 font_family='Helvetica')

    chart.candle_style(up_color='#00ff55', down_color='#ed4807',
                       border_up_color='#FFFFFF', border_down_color='#FFFFFF',
                       wick_up_color='#FFFFFF', wick_down_color='#FFFFFF')

    chart.volume_config(up_color='#00ff55', down_color='#ed4807')

    chart.watermark('1D', color='rgba(180, 180, 240, 0.7)')

    chart.crosshair(mode='normal', vert_color='#FFFFFF', vert_style='dotted',
                    horz_color='#FFFFFF', horz_style='dotted')

    chart.legend(visible=True, font_size=14)

    chart.set(df)

    chart.show(block=True)

styling image


6. Callbacks:

import pandas as pd
from lightweight_charts import Chart


def get_bar_data(symbol, timeframe):
    if symbol not in ('AAPL', 'GOOGL', 'TSLA'):
        print(f'No data for "{symbol}"')
        return pd.DataFrame()
    return pd.read_csv(f'bar_data/{symbol}_{timeframe}.csv')


def on_search(chart, searched_string):  # Called when the user searches.
    new_data = get_bar_data(searched_string, chart.topbar['timeframe'].value)
    if new_data.empty:
        return
    chart.topbar['symbol'].set(searched_string)
    chart.set(new_data)


def on_timeframe_selection(chart):  # Called when the user changes the timeframe.
    new_data = get_bar_data(chart.topbar['symbol'].value, chart.topbar['timeframe'].value)
    if new_data.empty:
        return
    chart.set(new_data, True)


def on_horizontal_line_move(chart, line):
    print(f'Horizontal line moved to: {line.price}')


if __name__ == '__main__':
    chart = Chart(toolbox=True)
    chart.legend(True)

    chart.events.search += on_search

    chart.topbar.textbox('symbol', 'TSLA')
    chart.topbar.switcher('timeframe', ('1min', '5min', '30min'), default='5min',
                          func=on_timeframe_selection)

    df = get_bar_data('TSLA', '5min')
    chart.set(df)

    chart.horizontal_line(200, func=on_horizontal_line_move)

    chart.show(block=True)

callbacks gif


Documentation

Inquiries: shaders_worker_0e@icloud.com


This package is an independent creation and has not been endorsed, sponsored, or approved by TradingView. The author of this package does not have any official relationship with TradingView, and the package does not represent the views or opinions of TradingView.


Related repositories
matplotlib/matplotlib

matplotlib: plotting with Python

PythonPyPImatplotlibdata-visualization
matplotlib.org/stable/
23k8.4k
bokeh/bokeh

Interactive Data Visualization in the browser, from Python

TypeScriptnpmBSD 3-Clause "New" or "Revised" Licensebokehpython
bokeh.org
20.4k4.3k
rougier/scientific-visualization-book

An open access book on scientific visualization using python and matplotlib

PythonPyPIOtherpythonmatplotlib
labri.fr/perso/nrougier/
11.4k1k
leeoniya/uPlot

📈 A small, fast chart for time series, lines, areas, ohlc & bars

JavaScriptnpmMIT Licensetime-seriesohlc
10.3k461
ranaroussi/quantstats

Portfolio analytics for quants, written in Python

PythonPyPIApache License 2.0quantalgotrading
7.5k1.2k
ScottPlot/ScottPlot

Interactive plotting library for .NET

C#MIT Licenseplotplotting
scottplot.net
6.7k1k
epezent/implot

Immediate Mode Plotting

C++MIT Licenseimguiplotting-library
6.2k689
biolab/orange3

🍊 :bar_chart: :bulb: Orange: Interactive data analysis

PythonPyPIOtherdata-miningdata-science
orangedatamining.com
5.7k1.1k
asmuth/clip

Create charts from the command line

C++Apache License 2.0plottingplots
clip-lang.org
5.1k382
has2k1/plotnine

A Grammar of Graphics for Python

PythonPyPIMIT Licenseplottinggrammar
plotnine.org
4.7k252
plotters-rs/plotters

A rust drawing library for high quality data plotting for both WASM and native, statically and realtimely 🦀 📈🚀

Rustcrates.ioMIT Licenserustvisualization
plotters-rs.github.io/home/
4.6k317
jtablesaw/tablesaw

Java dataframe and visualization library

JavaMavenApache License 2.0dataframedata-frame
jtablesaw.github.io/tablesaw/
3.8k649